Numbers
Herein lie numbers that characterize Kootenay Lake. Various sources differ slightly in the values offered, so this information should be viewed as tentative. Some of the variability might result from whether a author included the West Arm in the measurements or not. This information is expected to undergo refinement and expansion.
Also available is a Chronology of the Lake.
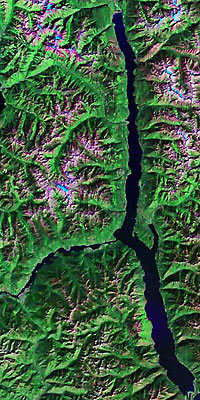 Kootenay Lake bears a vague resemblance to a bow and arrow with the Main Lake being the bow, and the West Arm being the arrow. The Purcell Mountains lie to the east of the Main Lake, and the Selkirk Mountains lie to the west.
Location
Altitude (above sea level): 532 m; seasonal variability, ~3 m.
Farthest southern latitude is 49°15’ north (Kootenay Landing).
Farthest northern latitude is 50°11’ north (Argenta).
Farthest eastern longitude is 115°39’ west (Kuskanook).
Farthest western longitude is 117°17’ west (Nelson).
Dimensions of the Main Lake
Length (straight line): 104 km from north to south.
Length (along centre line): 107 km for a boat going down the Lake.
Width: average, 3.8 km; variable from 1.7 km to 5 km.
Depth: average, 94 m; maximum, 150 m.
Surface Area: 390 km².
Volume: 37 km³.
Dimensions of the West Arm
Length (along the channel): 30 km for a boat to travel between
the Balfour dolphin and Nelson’s Orange Bridge.
Width of the West Arm: average .8 km (a guess),
variable from 0.1 km (Fraser Narrows)
to 1.4 km (Crescent Bay and Sunshine Bay)
Depth: average, 10 m (a guess), maximum, 47 m.
Area: 24 km² (a guess)
Slope: the Lake level drops ~15 cm between Balfour and Nelson.
Flow of water
Annual flow through the Lake averages about 25 km³ supplied by:
 Kootenay River flowing in at the south end of the Main Lake, 80%;
Duncan River flowing in at the north end of the Main Lake, 10%;
Smaller rivers (Kaslo) and myriad big and small creeks. 10%.
Residence time
Average residence time for water in the Lake
= (lake volume)/(volumetric flow rate)
= (37 km3)/(25 km3 year-1)
= ~1.5 years.
So, on average it takes about 1½ years for water to pass through the Lake. This is an interesting number in that the Lake probably completely overturns one or two times a year (in the spring and fall). Consequently, it is likely that all the water is replaced in the Lake over a period of a few years—it is unlikely that much of the bottom water in the Main Lake remains stagnant there for a long time. Likely, there is a difference between the residence times for the North and South Arms with the time being longer than average in the north and shorter in the south. The residence time for water in the West Arm is short, probably three or four days.
Relief
The higher adjacent mountains in the Selkirks and Purcells ascend about 2200 m above the Lake’s surface. (I have been hiking on Kokanee glacier above 2730 m at midday and swimming in the Lake at 532 m late that afternoon).
Forests
The nature of the forest surrounding Kootenay Lake changes with altitude:
532m (Lake level) to 1450m: Interior Cedar Hemlock zone.
1450m to 1950m: Englemann Spruce-Subalpine Fir zone.
1950m to 2600m: Englemann Spruce-Subalpine Fir parkland zone (previous link).
2600m and up: Alpine tundra zone.
The links, above, open a window to Selkirk College and Derek Marcoux’s discussion of the zone using the biogeoclimactic ecosystem classification in British Columbia.
Climatology
The following applies to Nelson. To one extent or another, it characterizes the region, with the caveat that many things vary with altitude. Some of this data was provided by Discover Nelson.
| MONTH | DAYLIGHT (hrs) | SUNSHINE (hrs) | SUNSHINE (%) | AVE. TEMP (C) | PRECIP (mm) | SNOWFALL (cm) | |
| January | 257 | 42.7 | 16.6 | -3.3 | 74.4 | 67.9 | |
| February | 278 | 71.7 | 25.8 | -0.7 | 57.4 | 37.1 | |
| March | 369 | 123.4 | 33.4 | 3.6 | 59.5 | 16.2 | |
| April | 419 | 174.4 | 41.6 | 8.3 | 50.1 | 2.5 | |
| May | 489 | 227.5 | 46.5 | 13.0 | 60.9 | 0.2 | |
| June | 502 | 241.1 | 48.0 | 16.9 | 64.3 | ||
| July | 503 | 305.0 | 60.6 | 19.9 | 43.9 | ||
| August | 453 | 271.3 | 59.9 | 19.8 | 42.0 | ||
| September | 379 | 191.6 | 50.6 | 14.3 | 43.7 | ||
| October | 328 | 124.0 | 37.8 | 7.8 | 51.6 | 1.6 | |
| November | 262 | 54.0 | 20.6 | 1.9 | 88.4 | 31.8 | |
| December | 240 | 33.4 | 13.9 | -2.4 | 93.1 | 67.4 | |
| Year | 4479 | 1876.0 | 41.9 | 8.3 | 729.3 | 224.7 | |
DAYIGHT The trends revealed in this table are really instructive. First look at the number of hours of daylight a month. It is smallest in December, and largest in June—well, ok, in July, but that is only because July has one more day than June—the average number of hours of daylight per day is higher in June, 16.7, than July, 16.2. The higher temperature in the summer than winter has to do both with the fact that the summer day is longer (evident in the table) and the fact that the Sun is higher in the sky (not seen in the table, but in the suncharts).
SUNSHINE Now, the Sun is not always visible even during the daylight hours: there are clearly fewer hours of sunshine a month than daylight. Like daylight, sunshine shows a minimum in the winter and maximum in the summer. Two things block the Sun and so reduce the number of hours of sunshine: mountains and clouds. Even on a cloudless day in Nelson, a larger fraction of the winter’s sunlight is blocked by mountains than the summer’s. This is evident on the suncharts. But, the direct effect of mountains blocking sunlight, while important in the understanding of spacial variations, is overshadowed by clouds for seasonal variations. Winters abound with stratus clouds in the valley; summers sport cumulus clouds passing along the ridges; the difference in fractional sunshine is considerable. So, the portion of daylight during which the Sun is visible is a minimum in December (14%) and a maximum in the relatively cloudless in July and August (60%).
TEMPERATURE As is expected, the average monthly temperature has a minimum in Winter and maximum in Summer, but the temperatures lag the sunshine. The solar heating may be greatest in June, but that just means that this is the time of greatest warming and so the temperature is rising most rapidly. The time of maximum temperature does not occur until the warming from the sunlight is matched by the (radiative) cooling of the ground—this occurs late in July. Similarly logic explains the minimum temperature in January rather than when the sunlight is least in December.
PRECIPITATION & SNOW Precipitation is a maximum in the winter when mid-latitudinal storms sweep across the region. Yet, thunderstorms make a significant contribution to precipitation in the region in the summer. For a discussion of the unexpectedly high precipitation in this region (despite being a long way from the coast), see the interior wet belt.
Population
The population within about 2½ km of the lakeshore is about 19,700 people. This is divided between the Lake’s arms roughly as follows: West, about 14,300 of which most live in Nelson (9300), North, about 2900, of which many live in Kaslo (1000), South, about 2500.
The population within about 25 km of the Lake (ten times the above distance) increases by about 8000 to about 27,700, mainly because it now includes people living along the Kootenay River, both upstream of the Lake, 5500 with most in Creston (4800), and downstream, 2500.
These numbers were based upon Stats Canada for the region, and an RDCK map showing the various referenced areas. For the West Arm, I took 2/3 of both Areas F and E, plus Nelson. For the North Arm, I took Area D plus Riondel (400). For the South Arm, I took Area A minus Riondel. Upstream is Creston plus half of Area C; downstream is the remaining 1/3 of Areas E and F. The numbers were then rounded to the nearest 100. The numbers increase if one were to consider farther out along the river in either direction.
Road Access
Vancouver is about 660 km from Nelson (at the West end of the West Arm). The track takes one over six mountain passes: Alison (1342 m), Sunday (1282 m), Rickter (682 m), Anarchist (1234 m), Eholt (1028 m), Paulson (1535 m).
Calgary is about 620 km from Nelson. The number of passes depends upon the route. A typical route from Calgary might involve Crowsnest Pass (1396 m), Moyie Summit (997 m), Kootenay Pass (1774 m), and Apex (942 m), but other routes have other passes. These numbers are based upon Neil Roughley’s site.
 What do I care about
numbers? I am a bird.
![]()